By Megan E. Shoda, Timothy R. Lathrop, and Martin R. Risch
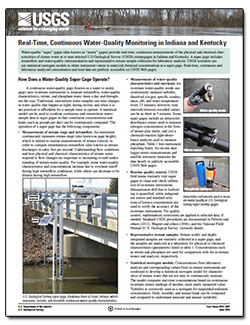
This fact sheet provides more details about how super gages operate, how super gages are being used, statistical surrogate models, quality control, and how to access data.
Indiana:
Tim Lathrop
(317) 600-2782
trlathro@usgs.gov
Kentucky:
Jeff Woods
(317) 600-2762
jwoods@usgs.gov
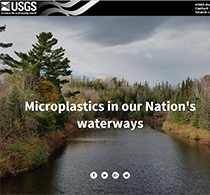
USGS Story Map
Microplastics are the miniscule plastic fragments (smaller than 0.04 inch) that fall off of decomposing plastic bottles and bags, and are intentionally manufactured into some toothpastes and lotions. Scientists have found microplastics nearly everywhere, particularly in lakes, rivers, and aquatic animals.
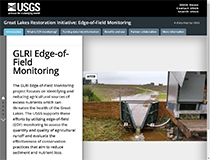
USGS Story Map
The GLRI Edge-of-Field Monitoring project focuses on identifying and reducing agricultural sources of excess nutrients which can threaten the health of the Great Lakes. The USGS supports these efforts by utilizing edge-of-field (EOF) monitoring to assess the quantity and quality of agricultural runoff and evaluate the effectiveness of conservation practices that aim to reduce sediment and nutrient loss.

Environmental Science and Technology
By: Austin K. Baldwin, Steven Corsi, and Sherri A. Mason
Plastic debris is a growing contaminant of concern in freshwater environments, yet sources, transport, and fate remain unclear. This study characterized the quantity and morphology of floating micro- and macroplastics in 29 Great Lakes tributaries in six states under different land covers, wastewater effluent contributions, population densities, and hydrologic conditions. Tributaries were sampled three or four times each using a 333 μm mesh neuston net. Plastic particles were sorted by size, counted, and categorized as fibers/lines, pellets/beads, foams, films...
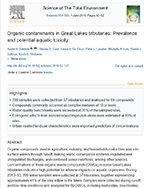
Science of the Total Environment
By: Austin K. Baldwin, Steven R. Corsi, Laura A. De Cicco, Peter L. Lenaker, Michelle A. Lutz, Daniel J. Sullivan, and Kevin D. Richards
Organic compounds used in agriculture, industry, and households make their way into surface waters through runoff, leaking septic-conveyance systems, regulated and unregulated discharges, and combined sewer overflows, among other sources. Concentrations of these organic waste compounds (OWCs) in some Great Lakes tributaries indicate a high potential for adverse impacts on aquatic organisms. During 2010–13, 709 water samples were collected at 57 tributaries, together representing approximately 41% of the total inflow to the lakes...
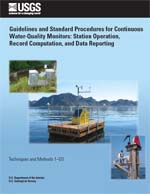
USGS Techniques and Methods 1-D3
By: Richard J. Wagner, Robert W. Boulger, Jr., Carolyn J. Oblinger, and Brett A. Smith
This report provides basic guidelines and procedures for use by U.S. Geological Survey (USGS) personnel in site and water-quality monitor selection, field procedures, calibration of continuous water-quality monitors, record computation and review, and data reporting. Two techniques for servicing continuous monitors are discussed in this report: (1) a method for servicing monitors in a well-mixed, stable, or slowly changing aquatic environment; and (2) a method for servicing monitors in a dynamic, rapidly changing aquatic environment as is commonly found in estuaries. A discussion of alternative methods for servicing monitors also is included. These basic guidelines are minimal requirements that may need to be modified to meet...
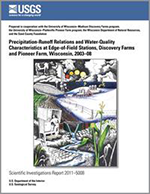
USGS Scientific Investigations Report 2011-5008
By: Todd D. Stuntebeck, Matthew J. Komiskey, Marie C. Peppler, David W. Owens, and Dennis R. Frame
A cooperative study between the U.S. Geological Survey, the University of Wisconsin (UW)-Madison Discovery Farms program (Discovery Farms), and the UW-Platteville Pioneer Farm program (Pioneer Farm) was developed to identify typical ranges and magnitudes, temporal distributions, and principal factors affecting concentrations and yields of sediment, nutrients, and other selected constituents in runoff from agricultural fields. Hydrologic and water-quality data were collected year-round at 23 edge-of-field monitoring stations on 5 privately owned ...
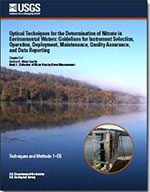
USGS Techniques and Methods 1-D5
By: Brian A. Pellerin, Brian A. Bergamaschi, Bryan D. Downing, John Franco Saraceno, Jessica D. Garrett, and Lisa D. Olsen
The recent commercial availability of in situ optical sensors, together with new techniques for data collection and analysis, provides the opportunity to monitor a wide range of water-quality constituents on time scales in which environmental conditions actually change. Of particular interest is the application of ultraviolet (UV) photometers for in situ determination of nitrate concentrations in rivers and streams. The variety of UV nitrate sensors currently available differ in several important ways related to instrument design that affect the accuracy of their nitrate concentration...
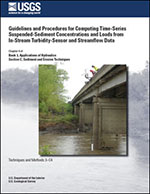
USGS Techniques and Methods 3-C4
By: Patrick P. Rasmussen, John R. Gray, G. Douglas Glysson, and Andrew C. Ziegler
In-stream continuous turbidity and streamflow data, calibrated with measured suspended-sediment concentration data, can be used to compute a time series of suspended-sediment concentration and load at a stream site. Development of a simple linear (ordinary least squares) regression model for computing suspended-sediment concentrations from instantaneous turbidity data is the first step in the computation process. If the model...
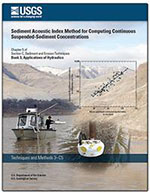
USGS Techniques and Methods 3-C5
By: Mark N. Landers, Timothy D. Straub, Molly S. Wood, and Marian M. Domanski
Suspended-sediment characteristics can be computed using acoustic indices derived from acoustic Doppler velocity meter (ADVM) backscatter data. The sediment acoustic index method applied in these types of studies can be used to more accurately and cost-effectively provide time-series estimates of suspended-sediment concentration and load, which is essential for informed solutions to many sediment-related environmental, engineering, and agricultural concerns. Advantages of this approach over other sediment surrogate methods include:...
USGS Techniques of Water-Resources Investigations Book 9
By: U.S. Geological Survey
The development and use of a National Field Manual is necessary to achieve consistency in the scientific methods and procedures used, to document those methods and procedures, and to maintain technical expertise. USGS field personnel use this manual to ensure that the data collected are of the quality required to fulfill our mission.